


2 . Results and Discussion
2.1 Physical Properties at Room Temperature
Table 4 presents the linear change rate and reheating linear change of the two tabular alumina specimens after heat treatment at 1600 ℃. It can be seen from the data in the table that, ignoring the inherent measurement error of the test, the linear change rate of all specimens after heat treatment at 1600 ℃ is negligible, and there is no significant difference between them. All specimens exhibit linear shrinkage after reheating at 1600 ℃. This is mainly because the solid-solution reaction of alumina into spinel is a volume-expanding reaction. By comparing the three groups of formulations, the linear changes of castables with aggregate S and aggregate A are basically consistent.
| Specimen | Linear change rate /% | Permanent linear change after reheating at 1600 ℃ /% |
|---|---|---|
| 1# S | +0.04 | -0.48 |
| 1# A | +0.09 | -0.48 |
| 2# S | +0.02 | -0.76 |
| 2# A | +0.01 | -0.78 |
| 3# S | +0.03 | -0.54 |
| 3# A | +0.04 | -0.38 |
Table 4 Linear Change Rate of Specimens
Figure 2 shows the apparent porosity and bulk density of the three specimens after heat treatment. It can be observed that the apparent porosity decreases slightly, which may be attributed to the tighter packing of the specimens with the increased dosage of fine powder in the formulation.
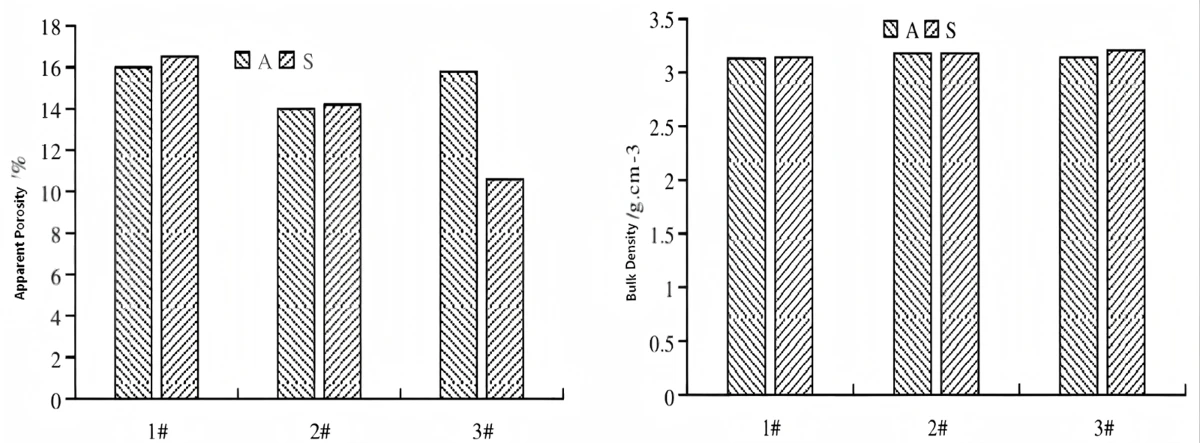
Figure 2 Apparent Porosity and Bulk Density of Different Specimens
Figure 3 shows the cold modulus of rupture and cold crushing strength of the three specimens after heat treatment. It can be seen that the strength of specimens with S aggregate is higher than that of specimens with A aggregate for all formulations. This may be because tabular alumina S has higher activity, which promotes better sintering of the specimens under identical conditions and thus achieves higher strength.
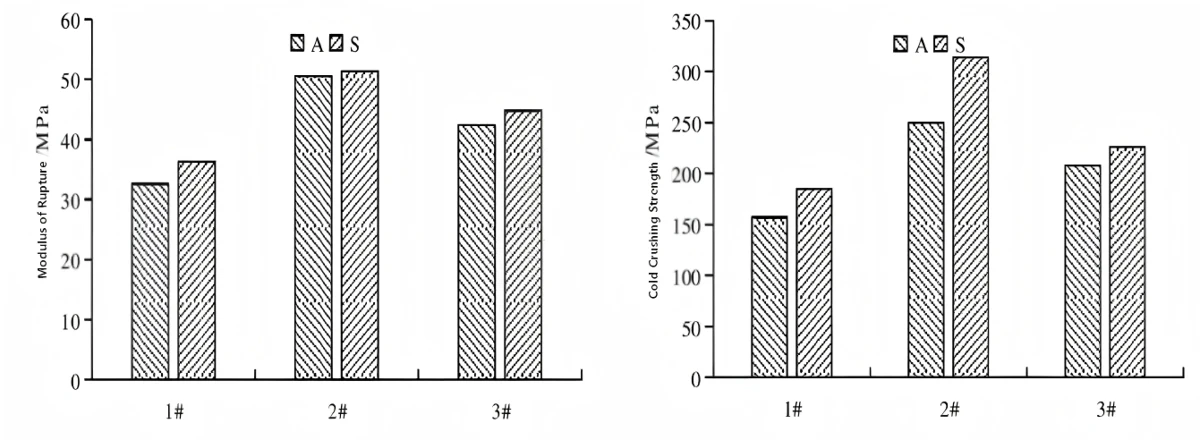
Figure 3 Cold Modulus of Rupture and Cold Crushing Strength of Different Specimens
2.2 Hot Modulus of Rupture
Figure 4 shows the hot modulus of rupture of the three specimens at 1400 ℃. It is considered that with the addition of spinel and chromium oxide green, an Al-Cr solid solution forms in the matrix, which strengthens the bonding inside the material. Comparing the effects of the two types of aggregates on the hot modulus of rupture of specimens, the difference is small, and the specimens with S aggregate are slightly higher.
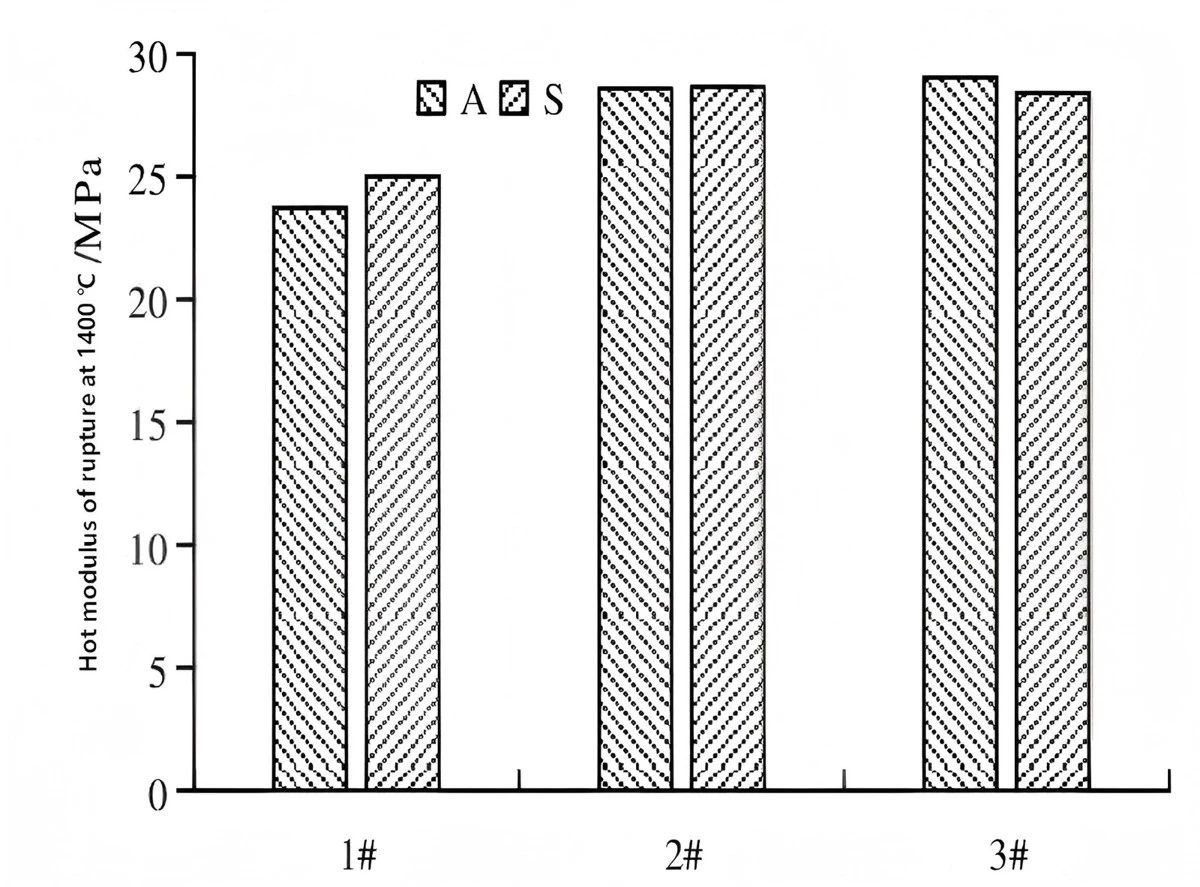
Figure 4 Hot Modulus of Rupture of Different Specimens at 1400 ℃
2.3 Thermal Shock Resistance
Figure 5 shows the residual modulus of rupture and strength retention ratio of the specimens after heat treatment at 1600 ℃ for 3 h and one thermal shock cycle by air cooling from 1100 ℃.
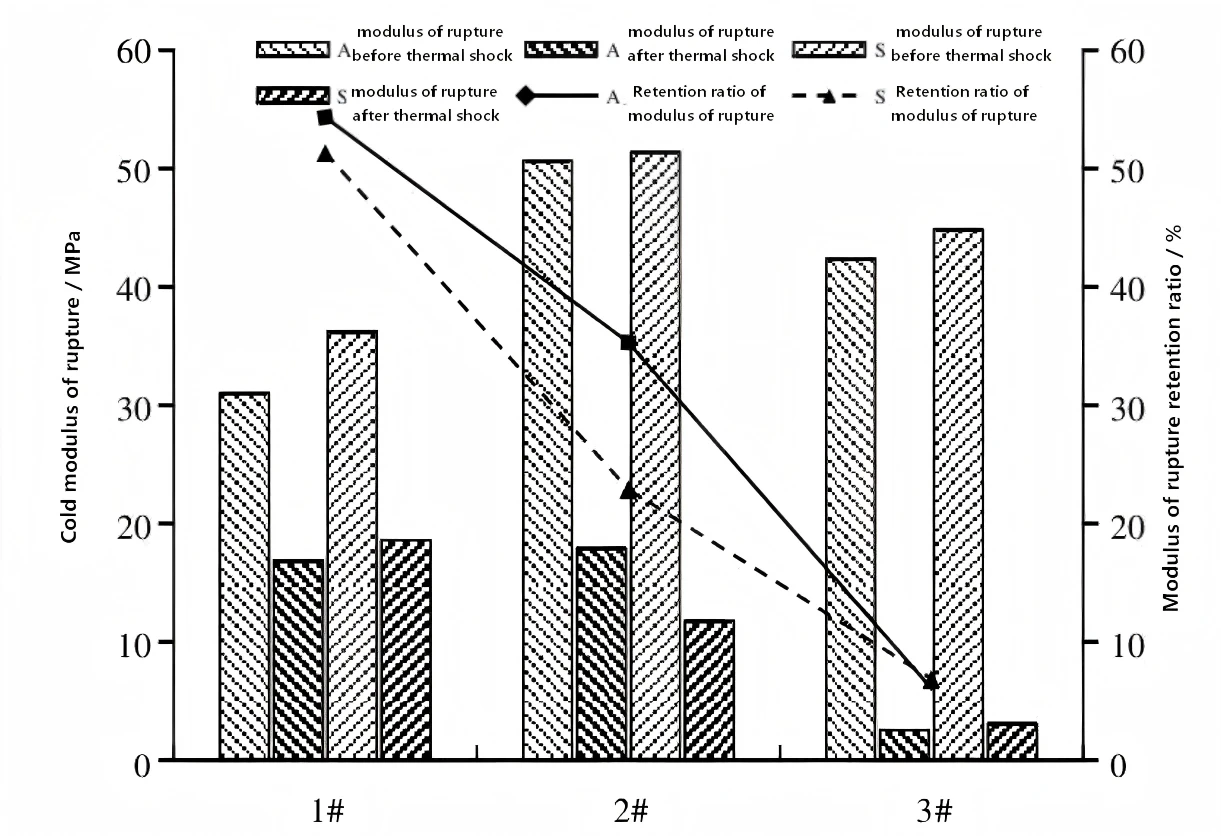
Figure 5 Thermal Shock Resistance of Different Specimens
It can be seen that, in general, the retention ratio of residual modulus of rupture of specimen A is higher than that of specimen S, indicating that under the same conditions, the specimens prepared with aggregate A exhibit slightly better thermal shock resistance. This is attributed to the relatively uniform micro-pores and grain structure of aggregate A. It can be found that the thermal shock resistance decreases obviously with the increase of specimen strength. Pursuing excessively high strength will inevitably lead to deterioration of thermal shock stability. Therefore, comprehensive consideration should be given to the material properties.
2.4 Microstructure
Specimens 1#, 2# and 3# were heat-treated at 1600 ℃ for 3 h.
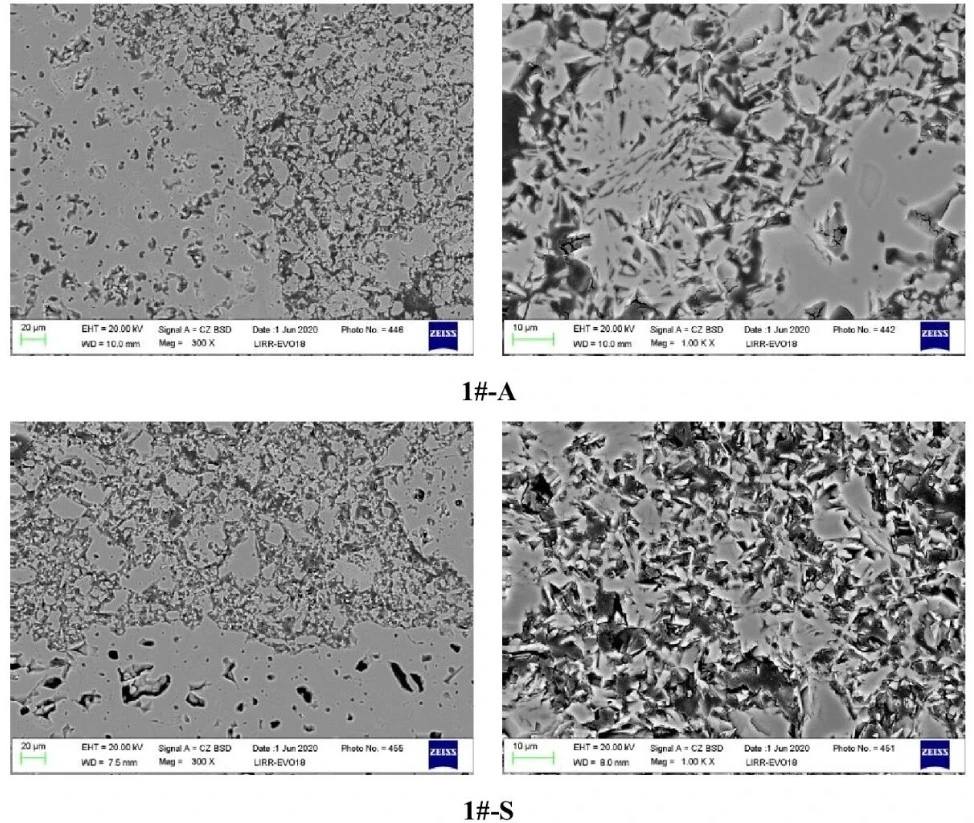
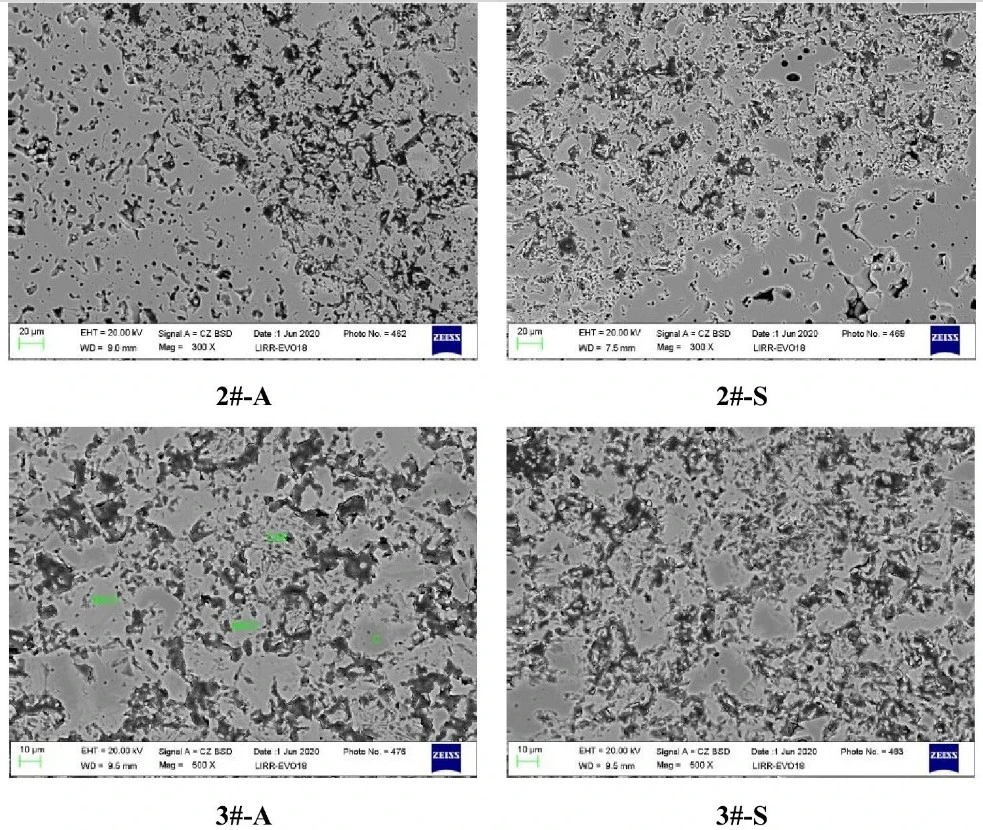
图6 经1600℃保温3 h热处理后试样的SEM照片
Some large particles in specimen S contain abundant internal pores, and there are differences between particles: fine particles are dense while coarse particles are relatively porous. In contrast, specimen A has a relatively uniform particle structure. CA6 crystals in the matrix are well-developed, and most of the crystal size is less than 10 μm. CA6 is enriched in specimen A, whereas CA6 is distributed more uniformly in the matrix of specimen S, which may be one of the reasons for the higher strength of specimen S. This may serve as the main reason for the strength improvement. The matrix and aggregates of specimen A are well bonded without interfacial reaction. By contrast, obvious reaction rims can be observed at the grain boundaries of specimen S. The phase compositions of the two specimens are basically identical. Most of Cr₂O₃ dissolves into spinel, contributing to the service strength. Overall, there is no significant difference between them.
3 . Conclusions
(1) The chemical compositions of the two tabular alumina aggregates are comparable. Compared with type A tabular alumina, type S tabular alumina has a slightly lower bulk density and inhomogeneous internal crystal development with obvious variation in crystal size. The largest crystals can reach 300 μm, while the smaller ones are approximately 10 μm. The crystal size of type A tabular alumina is mostly in the range of 10–50 μm with relatively uniform development.
(2) For the castables prepared from the two aggregates, the difference between aggregates exerts a certain influence on castable properties. Comprehensive comparison shows that the specimens prepared with type S tabular alumina possess slightly higher strength. Nevertheless, their hot modulus of rupture at 1400 ℃ is quite close with no remarkable difference.
(3) In terms of thermal shock resistance test from 1100 ℃, specimens with type A tabular alumina show better thermal shock performance. However, excessive pursuit of high strength will inevitably degrade thermal shock stability.
(4) According to the experimental results, suitable tabular alumina can be selected for practical production by comprehensively considering the key performance indicators of the final products.