


With the development of the steel industry, China's demand for high-quality clean steel and special steel keeps increasing. Magnesia-calcia refractories feature high temperature resistance and excellent steel melt purification capacity, showing broad application prospects as lining materials for clean steel smelting. Nevertheless, such materials suffer from poor sinterability, high hydration tendency and insufficient mechanical properties, which limit their wide application. Introducing oxide sintering aids to increase density is one effective method to tackle these drawbacks.
Rare earth oxides can form solid solutions with the main crystalline phases and activate crystal lattices to facilitate sintering. They can modify impurities in refractories, adjust the bonding between main crystals via intergranular phases, optimize the microstructure and improve the overall performances of materials. Previous studies have verified that adding Y₂O₃ into magnesia-calcia systems can reconstruct microstructure and enhance mechanical and hydration resistance. With favorable high-temperature chemical stability, Y₂O₃ also improves the resistance of refractories to refining slag corrosion.
Transition metal oxides can also promote the sintering of magnesia-calcia refractories. Additives such as Fe₂O₃ produce low-melting phases and reduce refractoriness and high-temperature mechanical strength. In contrast, ZrO₂ effectively improves sinterability and hydration resistance without deteriorating high-temperature properties, and nano-ZrO₂ presents a more remarkable densification effect.
In this work, Y(NO₃)₃·6H₂O and Zr(NO₃)₄·5H₂O were adopted as yttrium and zirconium sources to fabricate Y₂O₃/ZrO₂ co-doped MgO-CaO refractories with high Y₂O₃ content. Comparisons were made with samples singly doped by Y₂O₃ or ZrO₂. The microstructure, sintering behavior, mechanical properties and hydration resistance of specimens were investigated, and the effect of microstructure regulation on material performances was discussed.
1.Experimental
1.1 Raw materials
Mg(OH)₂ (Sinopharm Chemical Reagent Co., Ltd., AR) and Ca(OH)₂ (Sinopharm Chemical Reagent Co., Ltd., AR) were used as raw materials for fabricating MgO-CaO refractories. Y(NO₃)₃·6H₂O (Shanghai Aladdin Biochemical Technology Co., Ltd., AR) and Zr(NO₃)₄·5H₂O (Shanghai Macklin Biochemical Co., Ltd., AR) were adopted as additives.
1.2 Sample preparation
Mg(OH)₂ and Ca(OH)₂ were separately calcined in a muffle furnace at 700 ℃ for 3 h to convert them into MgO and CaO. CaO and MgO were batched at a molar ratio n(CaO):n(MgO)=65:35, followed by mixing with different types and dosages of additives (shown in Table 1). The additive dosages were calculated on the basis of CaO (batched by molar ratio). Distilled water was added into the mixture for slaking to obtain slurry. The slurry was wet-mixed in a polyurethane milling jar for 5 h and then spray-dried to acquire fine powders. The fine powders were lightly calcined in a muffle furnace at 700 ℃ for 3 h and cooled with the furnace. The powders were pre-shaped by die pressing and further compacted by cold isostatic pressing. The green compacts were sintered at 1600 ℃ for 3 h, cooled down to room temperature inside the furnace, and then characterized for microstructure and properties.
| Sample | n(Y203):n(Ca0) | n(ZrO2):n(Ca0) |
|---|---|---|
| MC | 0 | 0 |
| Y2.5 | 1.25:100 | 0 |
| Y10 | 5:100 | 0 |
| Z0.5 | 0 | 0.5:100 |
| Z1 | 0 | 1:100 |
| Z3 | 0 | 3:100 |
| YZ0.5 | 5:100 | 0.5:100 |
| YZ1 | 5:100 | 1:100 |
| YZ3 | 5:100 | 3:100 |
| YZ6 | 5:100 | 6:100 |
Table 1 Formulations of samples
1.3 Characterization of samples
X-ray diffractometer (XRD) was used to analyze the phase composition of sintered samples. Field emission scanning electron microscope (FESEM) in backscattering mode was adopted to observe the microstructure on thermally etched surfaces of sintered and polished specimens. Energy dispersive X-ray spectroscopy (EDXS) was applied for micro-area elemental analysis. The linear change rate after firing of samples was calculated according to Equation (1).
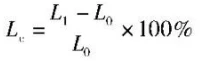
Where: \(L_\text{c}\) = linear change rate after firing, %; \(L_1\) = length of sample after sintering, mm; \(L_0\) = length of sample before sintering, mm. Based on Archimedes' principle, the apparent porosity (AP) and bulk density (BD) of the materials were tested in accordance with GB/T 2997-2015, Test method for bulk density, apparent porosity and true porosity of dense shaped refractory products. The calculation formulas are shown in Equations (2) and (3).
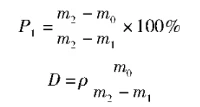
Where: \(P_1\) = apparent porosity of sample, %; \(m_0\) = dry mass of sample, g; \(m_1\) = suspended mass of sample in kerosene, g; \(m_2\) = saturated mass of sample, g; \(\rho\) = density of kerosene, 0.8 g·cm⁻³; D = bulk density of sample, g·cm⁻³.
The cold modulus of rupture of specimens was tested by the three-point bending method (span = 25 mm, crosshead loading rate = 0.5 mm/min). The sintered samples were crushed and sieved to obtain particles with particle size of 1–3 mm. The particles were filled into crucibles and placed in an autoclave for hydration test at 0.2 MPa for 30 min. The mass of samples before and after hydration was measured to evaluate the hydration resistance, and the calculation formula is shown in Equation (4).
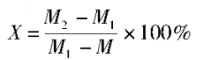
Where: X = hydration mass gain rate, %; M = mass of crucible, g; \(M_1\) = mass of sample and crucible before hydration, g; \(M_2\) = mass of sample and crucible after hydration, g.
2.Results and discussion
2.1 Single-doped MgO-CaO refractories with Y₂O₃ and ZrO₂
2.1.1 Phase composition
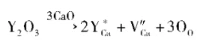
Figure 1 shows the XRD patterns of single-doped MgO-CaO samples with different contents of Y₂O₃ and ZrO₂. Diffraction peaks of Y₂O₃ can be observed in both Y2.5 and Y10 samples, and the intensity of Y₂O₃ diffraction peaks increases with the increase of Y₂O₃ addition amount. Compared with the MC sample, the main CaO peak of Y10 sample shifts to the right. According to Bragg's law, the unit cell parameter of CaO in Y10 sample is relatively smaller. The ionic radius of Y³⁺ is close to that of Ca²⁺, so solid solution readily occurs between them. Therefore, the shift of the main CaO peak is caused by the substitution of Ca²⁺ in CaO lattice by Y³⁺, and the corresponding defect reaction equation is shown in Equation (5).
Only diffraction peaks of MgO and CaO were detected in the Z0.5 sample. When a higher content of ZrO₂ was introduced, diffraction peaks of CaZrO₃ appeared in the XRD patterns of Z1 and Z3 samples, while no diffraction peaks of ZrO₂ were detected. This indicates that all the introduced ZrO₂ in the system reacted with CaO to form CaZrO₃.
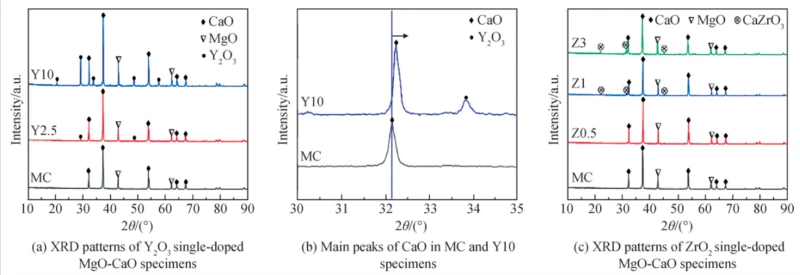
Figure 1 XRD patterns of Y₂O₃ and ZrO₂ single-doped MgO-CaO samples
2.1.2 Microstructure
Figure 2 shows FESEM images of Y₂O₃ single-doped MgO-CaO samples with different doping contents and EDS mapping results of sample Y10. In the FESEM image of blank MC sample, the light gray regions correspond to CaO while the dark gray regions are MgO, and the grain size of CaO is obviously larger than that of MgO. The CaO grain size of sample Y2.5 increases significantly compared with the MC sample. According to the EDS results listed in Table 2, the bright white regions observed in Y₂O₃-doped samples (Y2.5 and Y10) are Y₂O₃. As shown in Figure 2(c), sample Y10 contains abundant pores with distinct Y₂O₃ particles, and the CaO grain size decreases. Y₂O₃ and MgO are distributed around CaO grains, which reduces the direct contact between CaO grains and weakens the bonding among CaO grains in the system. Figure 2(c)–(h) present the EDS mapping results corresponding to Figure 2(d). Combined with Table 2, Y element can be detected inside CaO grains, indicating that the introduced Y₂O₃ dissolves into the CaO lattice. Light-colored band-like regions appear at the edges of CaO grains in Figure 2(d). Besides Ca and O elements, a small amount of Y element exists in these regions. Comparison of EDS results at point 2 and point 3 reveals that the light-colored band-like regions possess higher Y content than the CaO grains.
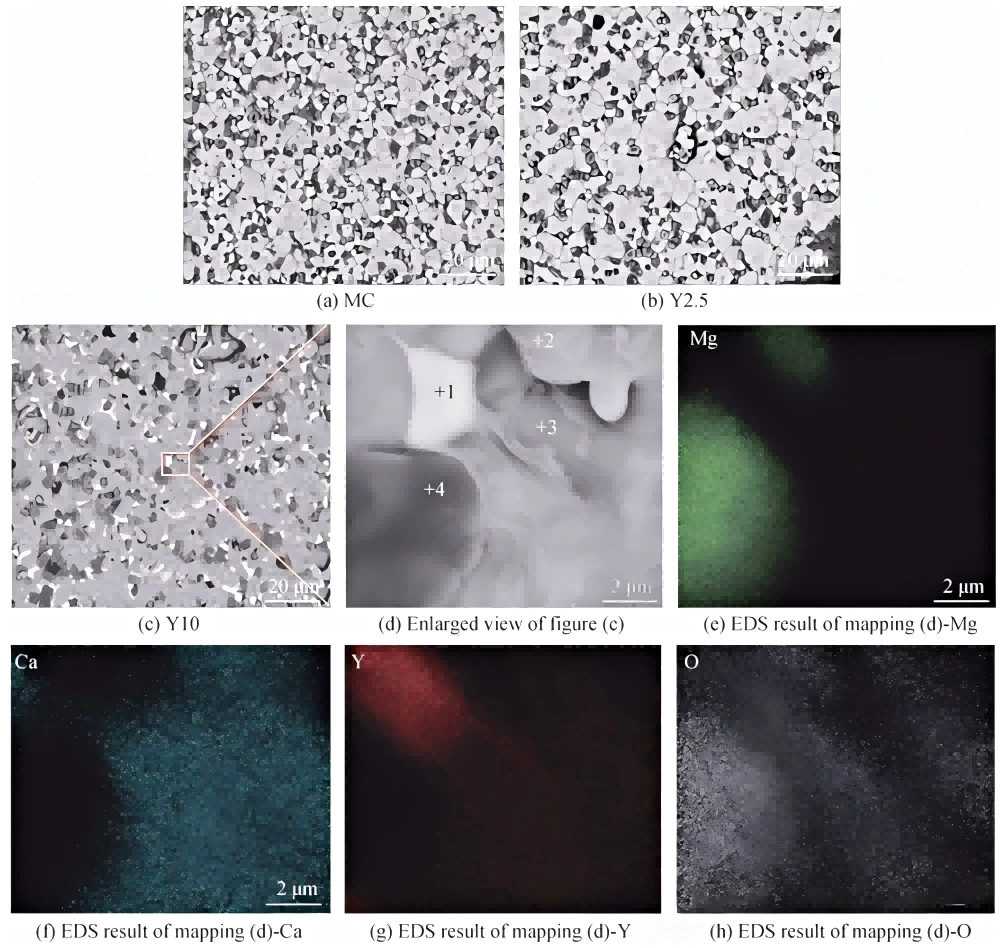
Figure 2 FESEM images and EDS mapping results of Y₂O₃ single-doped MgO-CaO samples
| Sample ID | Atomic fraction/% | |||
|---|---|---|---|---|
| Mg | Ca | Y | O | |
| Point 1 | 0.35 | 0.21 | 40.89 | 58.55 |
| Point 2 | 0.44 | 42.11 | 8.12 | 49.33 |
| Point 3 | 0.43 | 48.05 | 1.21 | 50.30 |
| Point 4 | 49.12 | 0.77 | - | 50.11 |
Table 2 EDS point scanning results of marked points in Figure 2
Figure 3 shows FESEM images and EDS mapping results of ZrO₂ single-doped MgO-CaO samples. According to the EDS mapping results, the dark gray regions correspond to MgO, the light gray regions are CaO, and the bright white regions are CaZrO₃. Spherical CaZrO₃ particles are observed in samples Z0.5, Z1 and Z3. CaZrO₃ distributes at the grain boundaries of CaO-MgO and CaO-CaO, which reduces the direct contact between CaO particles and exerts a positive effect on improving the hydration resistance of the material. Compared with the blank MC sample, at low ZrO₂ addition amounts, the CaO grain size becomes more uniform with the increase of ZrO₂ content. When the ZrO₂ addition amount rises to 3 mol%, abnormal grain growth of CaO occurs, and the aggregated regions of CaZrO₃ as well as pores in the material increase.
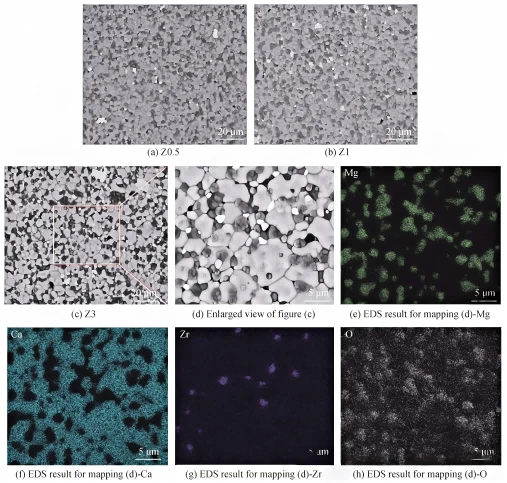
Figure 3 FESEM images and EDS mapping results of ZrO₂ single-doped MgO-CaO samples
2.1.3 Sintering properties
Figure 4 shows the linear shrinkage, apparent porosity and bulk density of Y₂O₃ and ZrO₂ single-doped MgO-CaO samples with different dopant contents. For ZrO₂ single-doped MgO-CaO samples, the linear shrinkage and bulk density first increase and then decrease with rising ZrO₂ content, while the apparent porosity exhibits an opposite trend. At low ZrO₂ addition amounts, CaZrO₃ formed by the reaction between ZrO₂ and CaO promotes the sintering of MgO-CaO refractories. In this work, ZrO₂ was introduced in the form of nitrate. Nano-sized ZrO₂ formed after decomposition possesses high reactivity and readily reacts with CaO. The generated CaZrO₃ fills the grain boundaries between MgO and CaO. In addition, the formation of CaZrO₃ is accompanied by a certain volume expansion, which can fill the pores inside MgO-CaO refractory samples and further improve the densification. When the ZrO₂ addition amount increases to 3 mol%, the amount of formed CaZrO₃ rises significantly. The volume expansion from the reaction makes CaZrO₃ occupy more space at the grain boundaries of the main crystalline phases, which weakens the bonding between CaO and MgO inside the material. The pores between particles increase in both quantity and size, leading to reduced densification. For Y₂O₃ single-doped MgO-CaO samples, the variation trends of linear shrinkage, bulk density and apparent porosity are consistent with those of ZrO₂ single-doped samples as Y₂O₃ addition increases. This is because the introduction of Y₂O₃ into MgO-CaO refractories enables Y³⁺ to dissolve into the CaO lattice and induce lattice distortion. The activated lattice accelerates the sintering densification process of the material. Nevertheless, when excessive Y₂O₃ is added, part of Y₂O₃ exists as an intergranular phase at the grain boundaries of CaO and MgO (as shown in Figure 2), inhibiting material sintering.
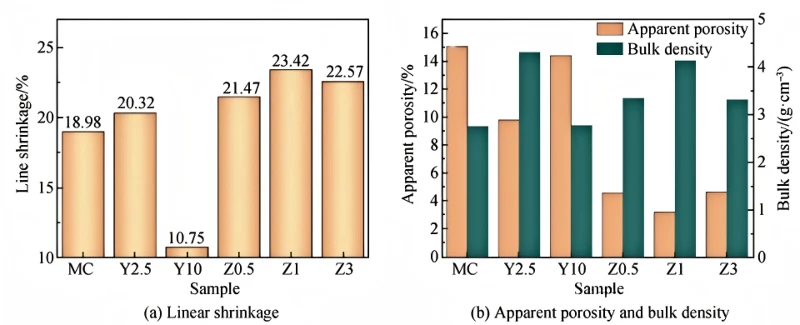
Figure 4 Linear shrinkage, apparent porosity and bulk density of Y₂O₃ and ZrO₂ single-doped MgO-CaO samples
Continue to the next article